This vignette demonstrates how to plot the ARTSS1–5 X-ray source catalog in galactic coordinates.
The dataset artss15 is included in the package in a
preprocessed form for reproducibility. It is based on the CDS/VizieR
catalog J/A+A/687/A183 (bibcode:
2024A&A...687A.183S).
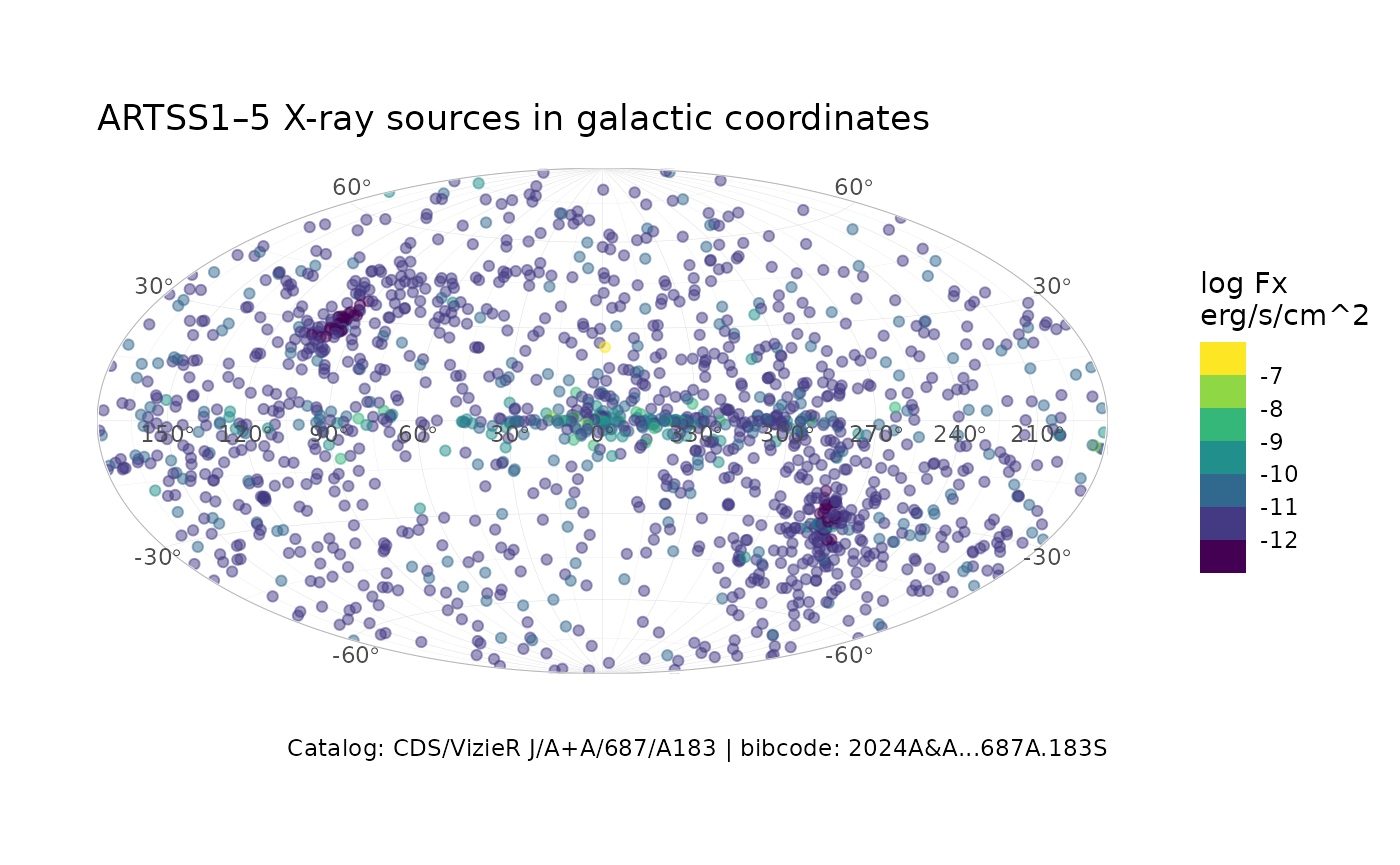
Main variables used below: - l, b: galactic
longitude and latitude (degrees) - flux: X-ray flux
(erg/s/cm^2)
In the plot, point color represents log10(flux).
Plot
ggplot(artss15, aes(l, b, color = log10(flux))) +
  geom_point(alpha = 0.5) +
  scale_color_viridis_b() +
  labs(
    title = "ARTSS1–5 X-ray sources in galactic coordinates",
    caption = "Catalog: CDS/VizieR J/A+A/687/A183 | bibcode: 2024A&A...687A.183S",
    color = "log Fx\nerg/s/cm^2"
  ) +
  coord_galactic()